Unlock Financial Freedom
Learn Best Share Market Classes in Pune
Start Learning Today From Basics to
Pro - Master the Stock Market in One Course
Discover the Essentials of Options Trading with Finearn Streamlined Options Trading - Master the Finearn's Method
Practical Learning I Real Market Experience

Proven
Strategies
Algo Trading
and Demo

ChatGPT & AI Tools
for
Stock Selection

Unlimited Practical
Sessions
Finearn Share Market Institute In Pune Select Your Learning Style
At Finearn, the leading share market Courses in Pune, we understand that everyone learns differently. Whether you prefer live classes, online sessions or one-on-one mentoring,
Read More
we offer flexible learning options tailored to your style. Choose the path that suits you best and start your journey toward becoming a confident investor today! Finearn Share Market Institute empowers traders with expert-led & market-driven education.
Finearn Stock Market Classes Isn’t Just Different, It’s Exceptional
In the ever-changing world of the stock market, the right guidance can make all the difference. What makes our Finearn share market classes stand out is our learner- focused, real-market approach.
We don’t just teach theory - we train minds to think like real traders and investors.


Why Do People Prefer Our Share Market Courses in Pune ?
Transform Your Trading Skills with Finearn Share Market Classes. Master the Finearn share market academy powered by Finearn stock market institute with our compre-hensive share market course near me!
Read More
Learn trading strategies and start invest confidently.
Join Finearn and gain practical knowledge, live trading experience, and lifetime support from industry experts.
Why Choose Finearn Share Market Classes In Pune
Discover a smarter way to learn – and earn.
Join Finearn’s share market classes in Pune and pave your path to financial independence and lasting success.
We Are No.1 Masterclass Share Market Academy
India’s Trusted Stock Market Institute
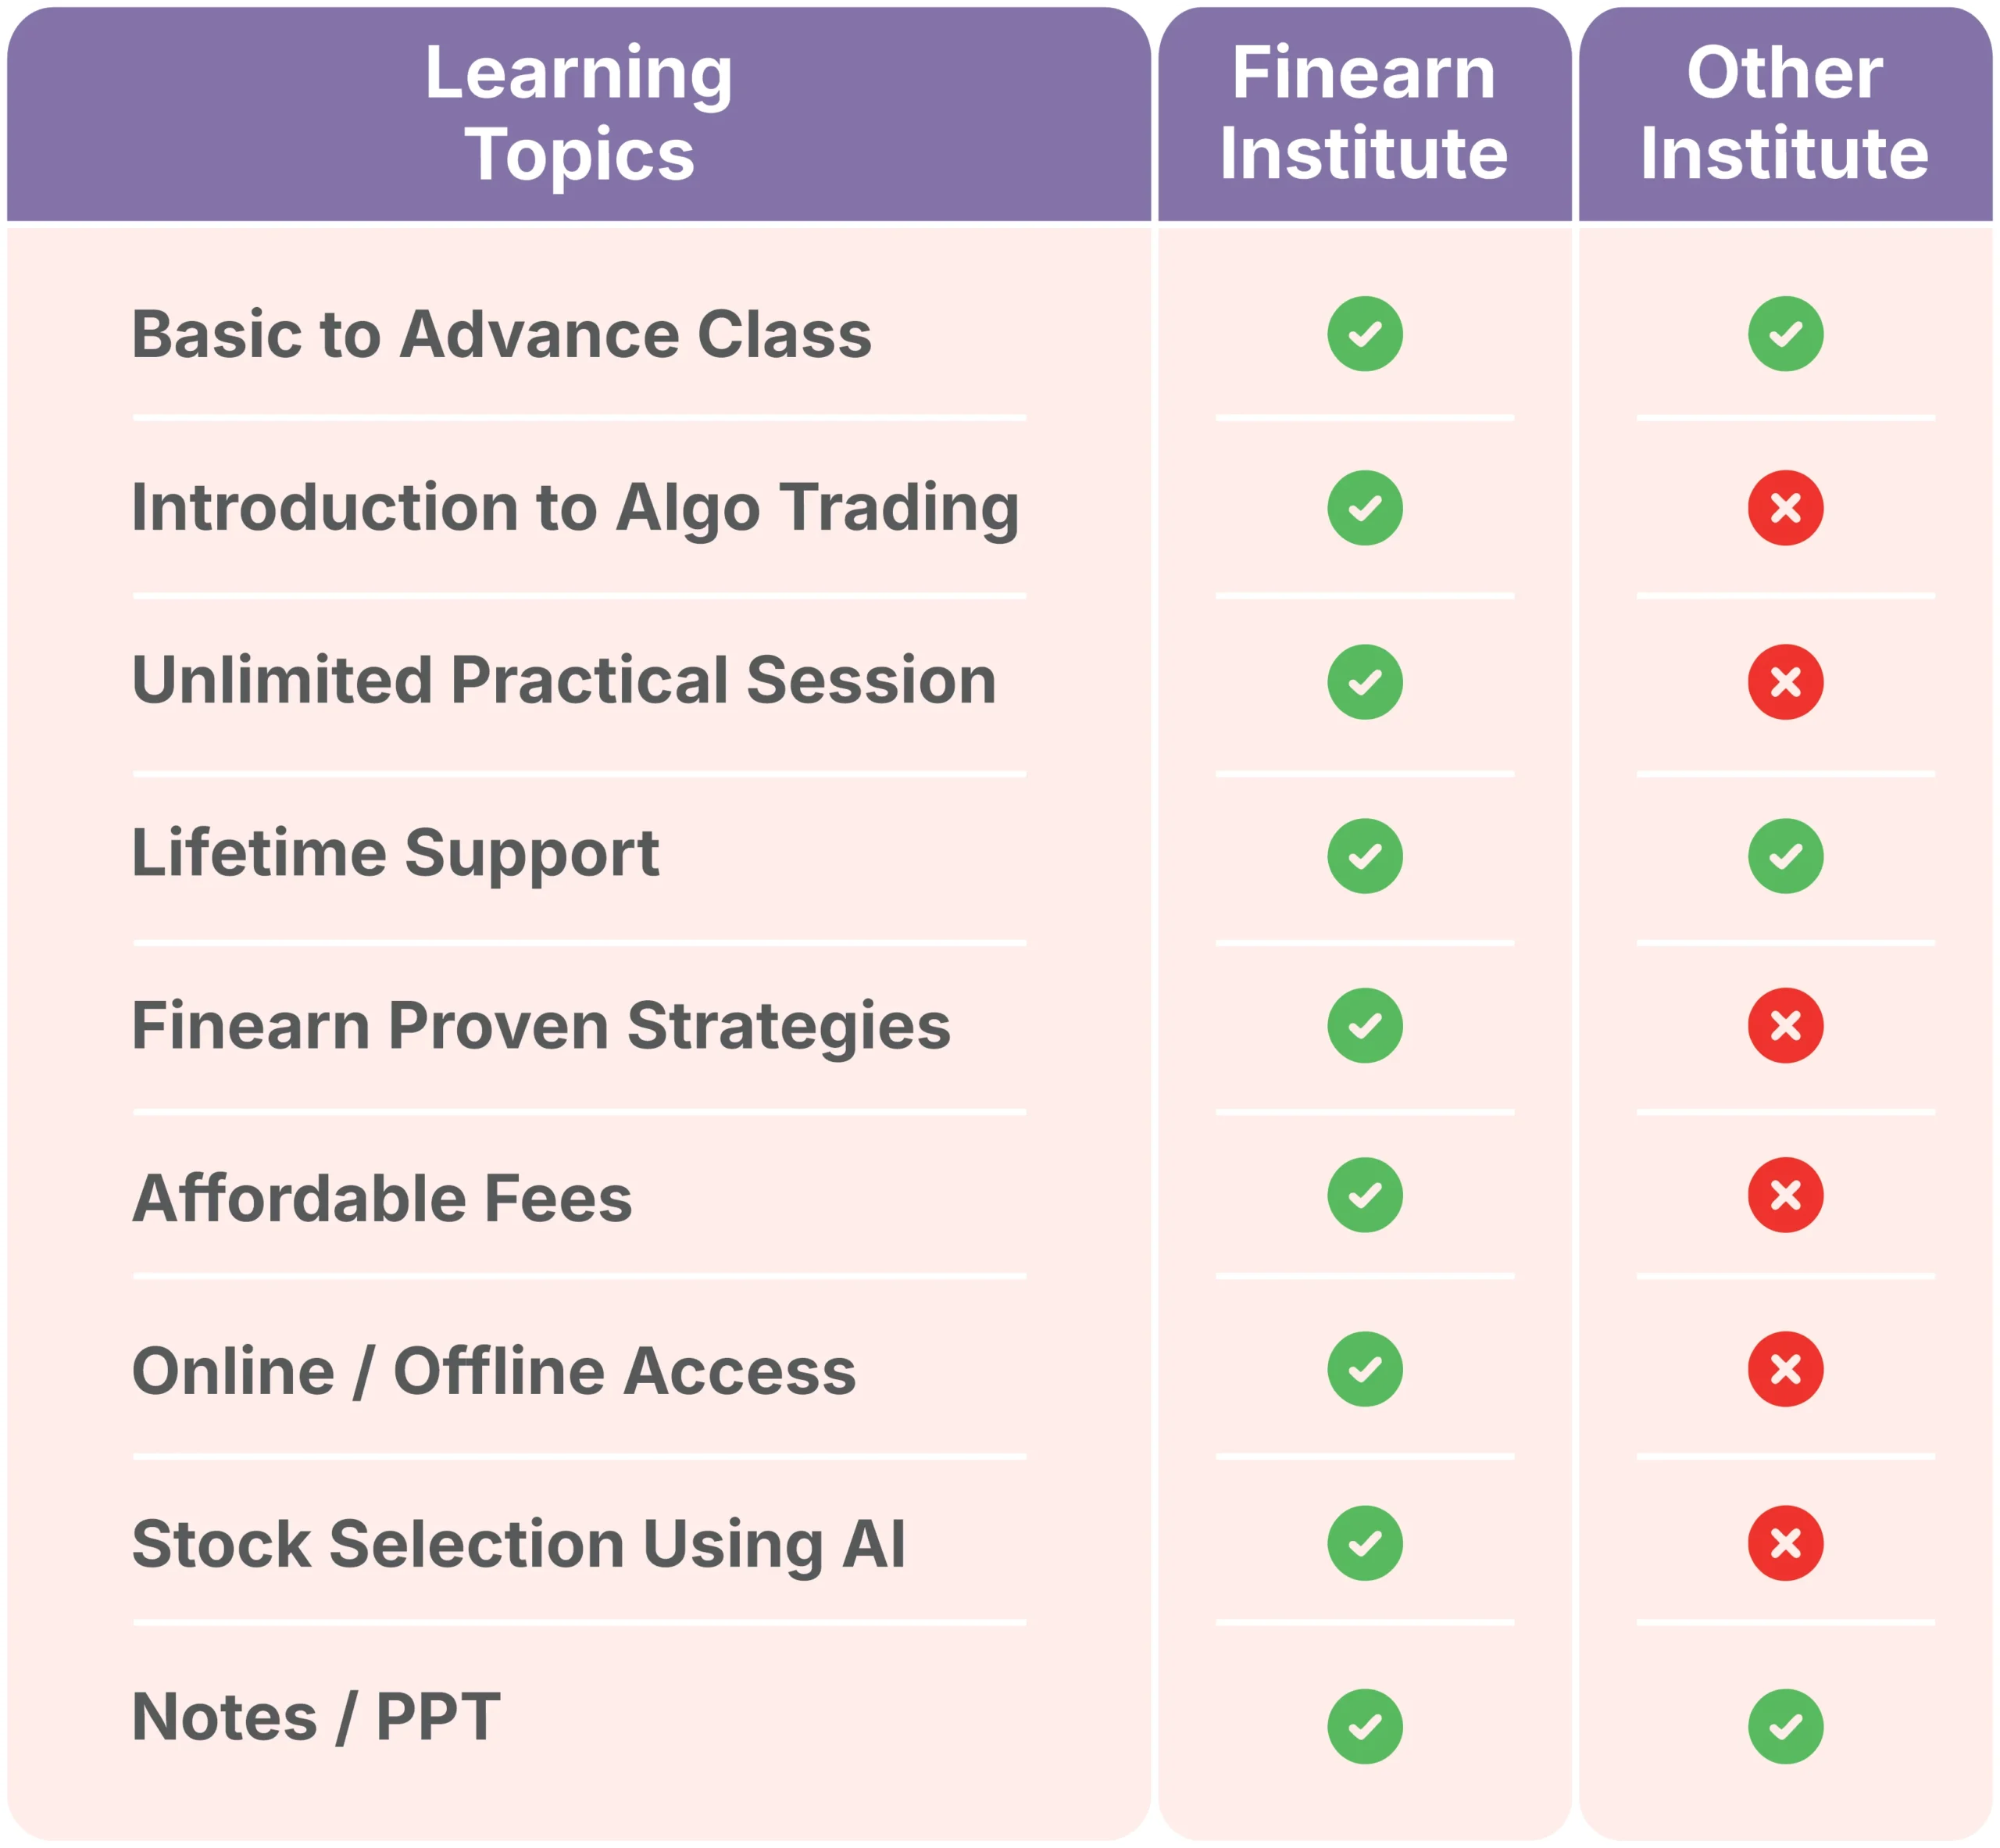
Unlimited Practical
Session
Get hands-on market experience with no limit on practice sessions to build real trading skills.
AI-Based Stock Selection
Learn how artificial intelligence is used to choose the right stocks based on smart data analysis.
Algo Trading Introduction
Understand the basics of automated trading and how algorithms can make trading faster and smarter.
Online & Offline Course Access
Learn at your convenience with both online sessions and offline classroom options.
Proven Strategies with Live Execution
Master tried-and-tested trading strategies and see them applied live in the real market.
Session-Wise Study Material
Access organized learning content tailored for each session to enhance step-by-step learning.
Trusted by 9000+ Learners
Join a large community of successful students who have benefited from this program.
Regular Updates & Market Exposure
Stay updated with the latest market trends and get real-time exposure to live trading environments.
Our Flexible Batch Timing
( Online & Offline Batch Available )
8:00 AM TO 10:00 AM
10:00 AM TO 12:00 PM
4:00 PM TO 6:00 PM
7:00 PM TO 9:00 PM

Duration
3 Weeks / 2 Hours Daily
Modules
Number of Modules - 08
Practical's
Unlimited Pactical Session
Flexible Batch
Online & Offline Courses
Finearn Share Market Classes Basic to Advance Single Masterclass Syllabus
Join the Finearn Share Market Courses in Pune for a compre-hensive 8-module Masterclass! From basics to advanced strategies, you will gain the confidence to succeed in the share market.
Enroll in our share market classes near me with fees that fit your budget!
Learn from experts and gain the skills to succeed in trading. Secrets of successful trading with our 8-module online share market classes. Whether you're a beginner or an experienced trader, our share market online classes offer in-depth lessons on everything from technical analysis to live market strategies.
Foundation of Stock Market
Indian Capital Market Structure
Fundamental Analysis & Research
Mutual Funds & Portfolio Manage
Technical Analysis & Research
Strategic Live Analytics
Trading Psychology
& Risk Manage
Practical Session on Live Market
Finearn with Best Share Market Courses In Pune Offering Free Services
Learn Share trading easily and efficiently with Finearn Share Market Classes! Our complimentary resources ensure that you maximize your course experience by applying the teachings in real life. If you encounter difficulties or have questions, our expert mentors are available to offer support whenever you need it.
Read More
Enjoy resources and study materials to learn at your pace.
Finearn Share Market Academy, powered by FINEARN Stock Market Institute, offers expert-led trading education for aspiring investors.

Call Today To Get Free DEMO
Get free counselling by our experienced counselors. We offer you free demo.
Why Finearn Share Market Classes is Pune's Best Choice?


FAQ's
You can enroll in our stock market classes, both online and offline, by paying a simple Rs 1000 enrollment fee and attending one session. If you find it unsuitable for any reason, we offer a full refund without any questions asked.
The fee for classroom classes is Rs 10,000, and for online classes, it is Rs 8,000. Discounts and special offers may apply under certain conditions.
We are the oldest share market institute in Pune and we have highly qualified trainers who are stock market experts. We teach copyrighted strategies to help you succeed in the market.
Both online and offline classes will include 5-day funda-mental, 5-day technical, and 5-day strategy sessions. Following this, practical sessions will be unlimited until you gain a comprehensive understanding.
The Basic to Advance Single Masterclass includes advanced content, eliminating the need for additional advanced classes.
No. Upon completing the stock market course with us, you will receive complimentary trading tools and advisory services.
We offer stock market classes from basic to advanced, conducted in a mix of Hindi and English.
Anyone with an interest in the share market, eager to learn, earn, and succeed, is welcome to join.
We offer lifetime support to those who complete the basic to advanced course.
No prior knowledge of the stock market is necessary, though any existing knowledge would be beneficial.
You can use any device, such as a mobile phone, laptop, or tablet, for both the course and trading purposes.
We offer a variety of learning formats to suit your needs, including offline classroom classes, online share market classes learning modules, and recording share market classes.
Yes. upon successful completion of our stock market courses, you will receive a certificate of completion from Finearn Stock Market Institute.
We accept various payment options for your convenience, including and bank transfers, gpy, phone pay We offer installment plans for our courses. Please get in touch with our admissions advisor for details.
For classroom sessions, we offer recordings or alternative arrangements to ensure you don't miss out on the material. For online courses, you can revisit modules at your convenience.
No prior experience is needed. Our stock market class is beginner-friendly and starts with the basics. Whether you're a student, working professional, or homemaker, you'll be guided step-by-step to understand market concepts and trading
techniques.
Invest Smarter with Our Finearn Share Market Blog
Want to learn stock market concepts with confidence? Look no further than the Finearn Share Market Training Institute blog!
How Option Trading Courses Teach Capital Protection Alongside Profit Strategies
In the rapid, fast-paced, competitive yet dynamic, volatile, fluctuating, and oscillating world of today, the significance of a Share Market
How Share Market Courses Teach Beginners to Read Company Financial Statements
Reading company financial statements without understanding their language can be like reading a book written in a language you don't
Request A Call Back
Just submit your mobile number and we’ll be in touch shortly.


