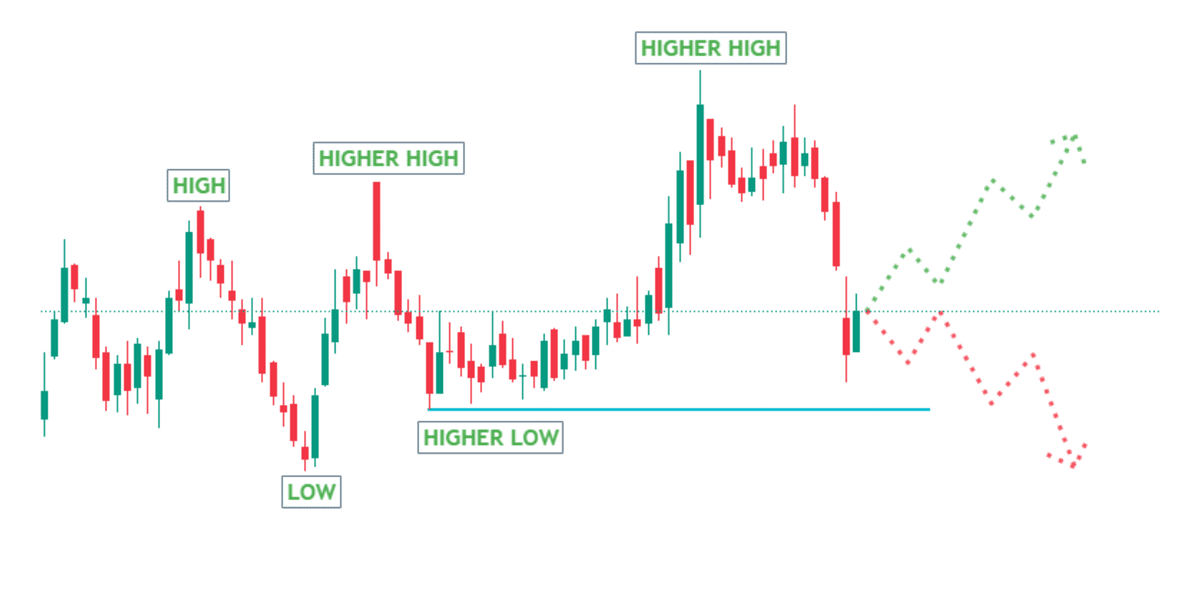
The chart depicts a clear uptrend, marked by a series of higher highs (HH) and higher lows (HL), indicating strong bullish momentum.
Current Market Scenario:
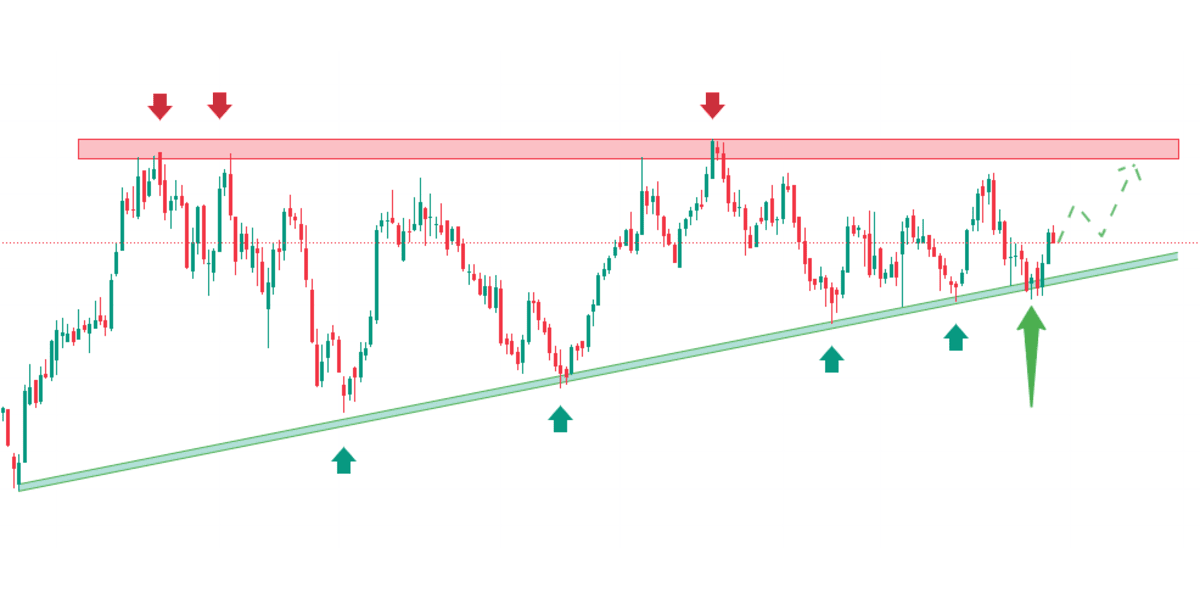
The price action is at a make-or-break situation.
It is currently near a key support zone (blue horizontal line).
From here, the price will either:
Make a new higher high, continuing the bullish trend.
Or break the support, leading to a change in the trend structure..
Key Levels to Watch:
Support: The blue horizontal line is critical. A breakdown below this level could lead to further downside.
Resistance: The previous higher high level acts as an important resistance for a bullish breakout.
Market Implications:
This is a decisive moment for the trend. Traders should monitor whether the price makes a new higher high or breaks below the support to confirm a trend change.
Volume and candlestick patterns at the support level will provide additional insights into the next move.
This analysis emphasizes the critical nature of the current market positioning, with the price at a turning point. The direction taken from this level will define the short-term trend trajectory.


 +91 95618 61818