Chart Analysis: Symmetrical Triangle with Support and Resistance
Updated 18 December, 2024 / Time: 19:13
Chart Pattern Overview:
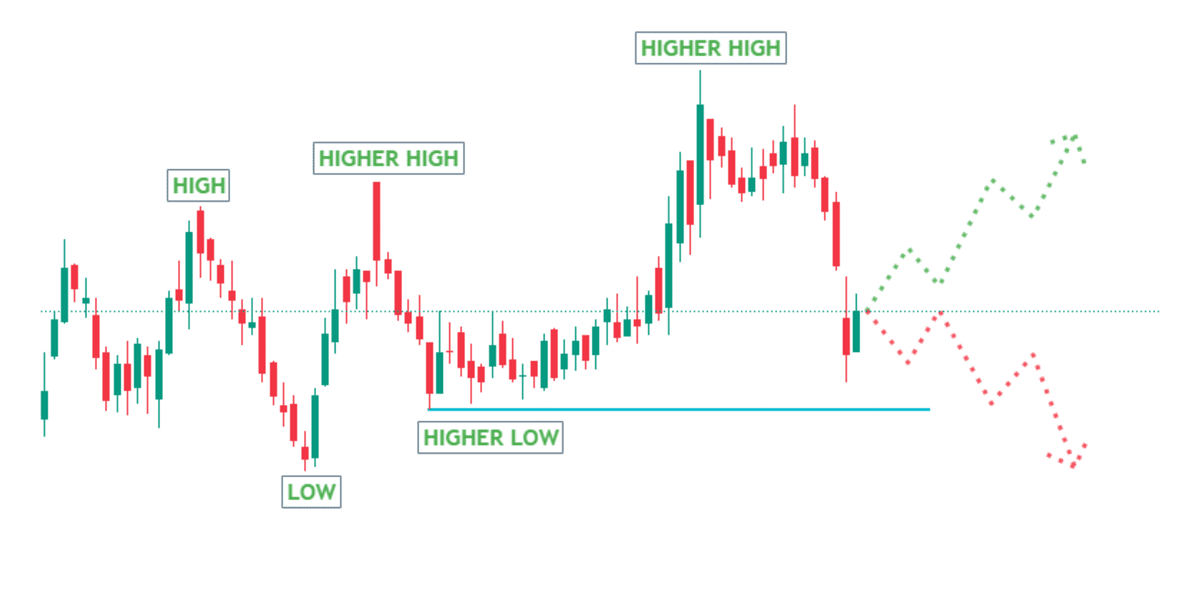
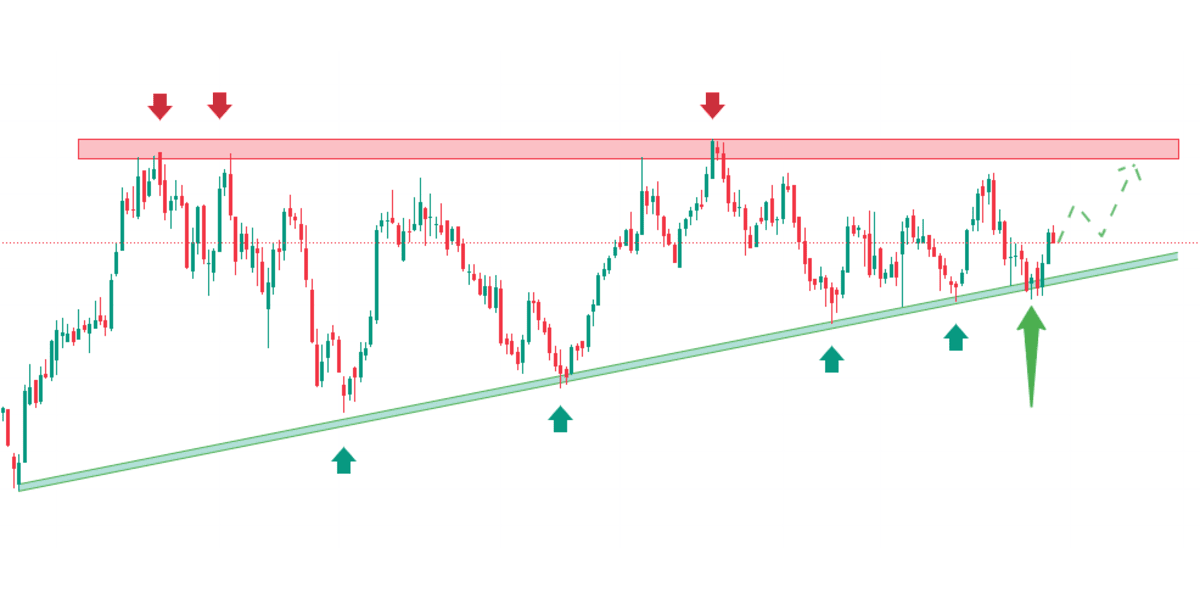
The chart depicts a symmetrical triangle pattern with clear higher lows (upward trendline) and a strong horizontal resistance zone.
The green upward arrows mark the points where the price has bounced off the trendline support.
The red arrows indicate repeated failures at the resistance zone, forming a supply zone.
Support and Resistance:
Support: The price is respecting the ascending trendline, forming consistent higher lows.
Resistance: The price has been repeatedly rejected near the red supply zone (horizontal resistance).
Current Market Action:
The most recent green candle indicates a bounce from the trendline support, suggesting buying strength.
A potential upward movement toward the resistance zone is marked by the green dashed arrows.
Key Observations:
The chart shows signs of accumulation, with buyers stepping in near the trendline.
If the price breaks above the resistance zone, it could trigger a bullish breakout with significant upside potential.
Conversely, if the trendline support breaks, the price may witness a bearish move.
This analysis highlights a strong upward bounce and the possibility of a bullish breakout if the resistance zone is breached. Traders should monitor the key levels for confirmation.


 +91 95618 61818