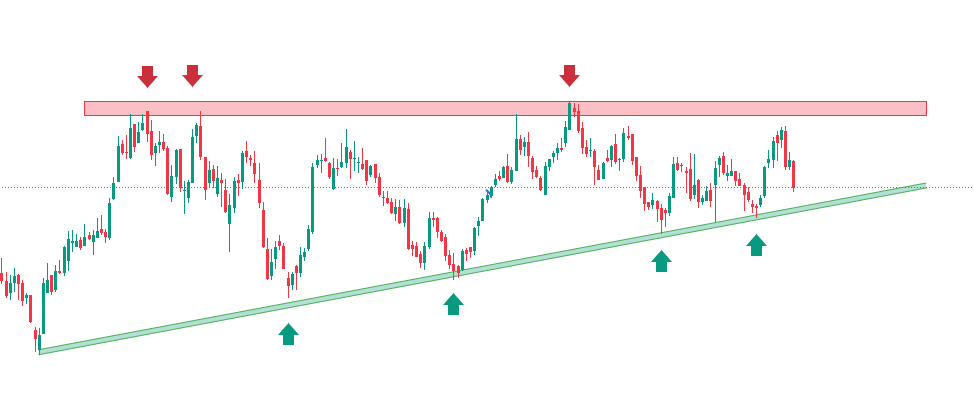
Bajaj Finance shows a classic ascending triangle pattern, a bullish continuation pattern often observed before a potential breakout. Here’s an in-depth analysis.
Current Situation:
The stock recently pulled back sharply (-5.45%) and is approaching the ascending trendline support around 6,900. If it holds above this support, it could make another attempt at breaking the resistance.
A break above the resistance zone (7,800–8,500) would confirm the triangle’s breakout, potentially signaling a strong upward move.
Triangle Pattern:
As the resistance remains steady and the support line rises, it creates the ascending triangle. This is typically seen as a bullish pattern, where buyers push the price higher over time, preparing for a breakout above resistance.
Key Takeaway:
Bullish breakout potential: The ascending triangle pattern indicates that the stock is gathering momentum, and a breakout above 8,500 could trigger a rally.
Conversely, breaking below the support line would negate the pattern, leading to a potential downside.
Learners
NISM Certified
Active Traders
Visitors