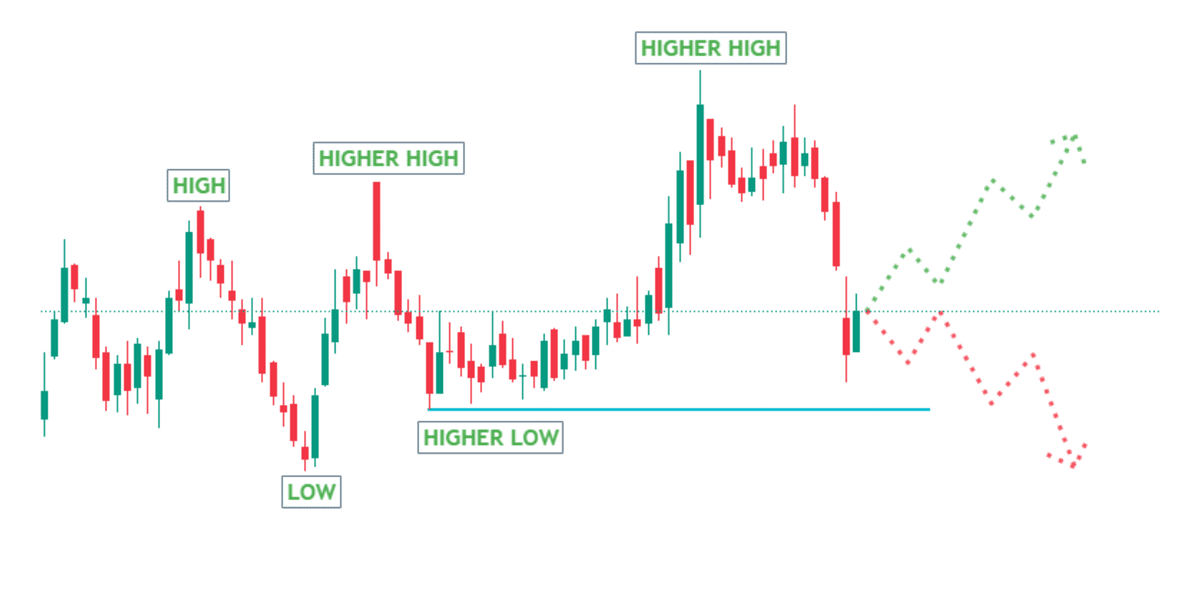
This analysis emphasizes the critical nature of the current market positioning, with the price at a turning point. The direction taken from this level will define the short-term trend trajectory.

It is a long established fact that a reader will be distracted by the readable content of a page when looking at its layout. The point of using Lorem Ipsum is that it has a more-or-less normal distribution of letters, as opposed to using

Following are the Mutual Funds we have studied and we feel are the best in each sector.
1) Large Cap Funds : Nippon India Large Cap Fund
2) Mid Cap Funds : Kotak Emerging Equity Funds
3) Flexi Cap Funds : Parag Parikh Flexi Cap Fund
4) Balanced Fund : HDFC Hybrid Debt Fund.

NTPC Green Energy IPO is a book built issue of Rs 10,000.00 crores. The issue is entirely a fresh issue of 92.59 crore shares.
NTPC Green Energy IPO opens for subscription on November 19, 2024 and closes on November 22, 2024. The allotment for the NTPC Green Energy IPO is expected to be finalized on Monday, November 25, 2024. NTPC Green Energy IPO will list on BSE, NSE with tentative listing date fixed as Wednesday, November 27, 2024.
The assets have grown significantly in the past 2 years they have grown from they have grown from 18000 crores to almost 32400 crores revenue has also grown from 170 crores to 1132 crores profit after tax is in the range of around 16% which is quite stable. The problem is in borrowing. Wwe see a growth of around 5000 crores in borrowing from 12000 crores to 17000 crores this is mainly because of the growth of assets whatever they borrowed they have purchased assets from the borrowing.
For shareholders quota you are eligible only if you have bought the shares before 11th November or on the 11th of November if we have purchase the shares after 12th November you are not eligible for shareholders quota.
The objects of the issue are very clear it would be using the proceeds of IPO to reduce the borings of another subsidiary which is NTPC renewable energy and other general corporate purpose so the objects of issue are very good and fruitful to the investors.
This is a huge nearly 10,000 crore IPO and will be the third largest in 2024 following Hyundai motor India 27870 crore IPO and Swiggy IPO of 11300 crore.
We can expect listing gain of around 10 to 20% on this IPO but considering it is in the renewable space and that is the future of Indian power sector this IPO is a very good share to hold for long term.
Key growth drivers are
Learners
NISM Certified
Active Traders
Visitors