eMS share market classes provide basic to Advance single SUPER course


In Technical analysis, we study past prices of an index/ Stock, Commodity or Currency with the assistance of certain mathematically derived tools to forecast future price movements. However, the simplest & most effective tool devoid of mathematical applications which identifies and confirms a trend is called a trendline and drawing channels.

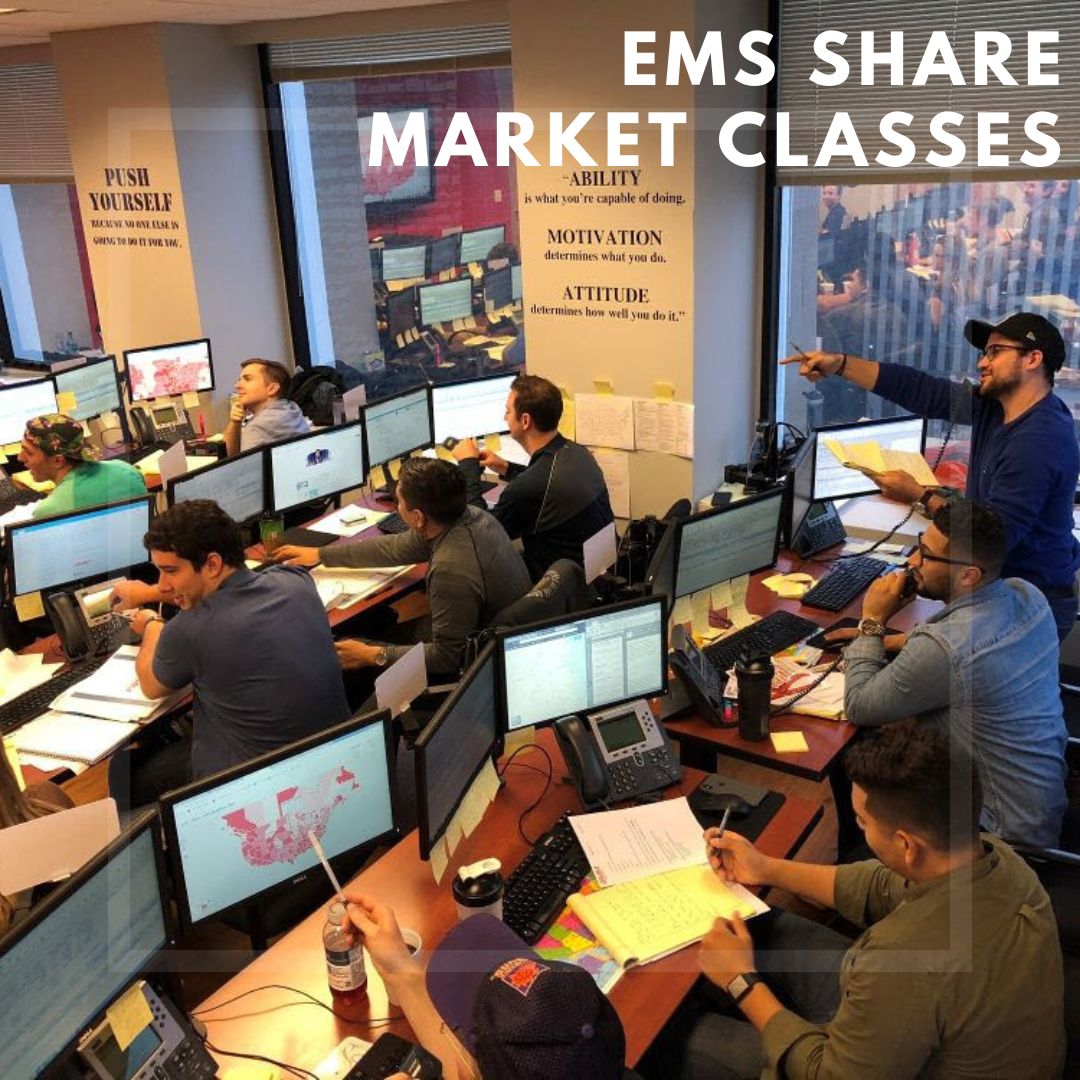
We at EMS Stock MARKET Institute in Pune teach this tool as it is very important and the very basic tool.
Stocks move up on Demand(buying) and go down because of supply (selling) or sideways because of a close fight between buyers & sellers. A trendline in most occasions will tell you all.
If you observe lane discipline and travel by the sign boards while driving, you reach your destination safe & sound. Similarly Trendlines help you reach your goals in the markets in a safer way.
A trend line is a straight line that connects two or more price points and then extends into the future to act as a line of support or resistance.
Uptrend Line(Demand line)
An uptrend line has a positive slope and is formed by connecting two or more low points. The second low must be higher than the first for the line to have a positive slope. Uptrend lines act as support and indicate that net-demand (demand less supply) is increasing even as the price rises. As long as prices remain above the trend line, the uptrend is considered solid and intact. A break below the uptrend line indicates that net-demand has weakened and a change in trend could be imminent.
Downtrend Line (Supply Line)
A downtrend line has a negative slope and is formed by connecting two or more high points. The second high must be lower than the first for the line to have a negative slope. Downtrend lines act as resistance, and indicate that net-supply (supply less demand) is increasing even as the price declines. As long as prices remain below the downtrend line, the downtrend is solid and intact. A break above the downtrend line indicates that net-supply is decreasing and that a change of trend could be imminent.
As long as the larger trendline is intact, each sideways move will get resolved in favour of the main trend.
The magic of trendlines unfold into Channels when parallel lines are drawn and these channels give you often the “targets” to book out.
As the steepness of a trend line increases, the validity of the support or resistance level decreases.
The angle of a trend line created from such sharp moves is unlikely to offer a meaningful support or resistance level.
A balanced approach combined with some trend following Indiactor like Supertrend is our Secret of creating winning trades here at the EMS Stock Market courses in pune .
It is very beneficial in intraday as well as positional trading. Come and learn with us the art of trading here at EMS Share Market Classes in Pune. Pune.
Thank you
Ems Share market classes in Pune Contact -8530983737/3838

March 11, 2019 / by EMS
March 11, 2019 / by EMS

March 11, 2019 / by EMS


Click one of our representatives below to chat on WhatsApp or send us an email to info@emssharemarketclasses.in